Climate Change Wairarapa
Follow us on Facebook
We listened to our community when they said they wanted our council to take more meaningful actions towards mitigating the effects of climate change.
Our Climate Change Advisor, Mélanie Barthe was appointed in September 2019 to write a strategy for South Wairarapa District Council and Carterton District Council outlining what meaningful action we can take to reduce the effects of climate change in their daily council operations.
The Ruamāhanga Strategy was first adopted in 2020 and revised in 2021.
- 2021 strategy Vol 1: strategy
- 2021 strategy Vol 2: action plan
As part of its action plan SWDC measure its greenhouse gas emissions every year since 2018:
SWDC 2021 Greenhouse Gas Inventory
Other GHG inventories are also available: - The Wairarapa GHG inventory
- Wellington region GHG inventory
Council Projects
South Wairarapa District Council has committed to mitigate and adapt to climate change. Climate change mitigation means reducing our greenhouse gas emissions. Climate change adaptation means adapting to the impacts of climate change such as increased flooding risks, etc. In that respect, South Wairarapa District works on important projects such as:
- Home Health Assessment Kit
- Water conservation
- Recycling and zero waste
- Conservation week
- Climate Change Dashboard (below)
Note that the Volume 2 of the Ruamāhanga Strategy (Action Plan) provides an update on the work done on all the actions listed in the strategy.
Climate Change Projections in the Wairarapa
| 2040* | 2090* | 2040** | 2090** | |
| Max temperature | +0.75 – 1.25°C | +1.25 – 1.75°C | +0.75 – 1.50°C | +2.50 – 4.00°C |
| Minimum temperature | +0.50 – 0.75°C | +0.75 – 1.25°C | +0.50 – 0.75°C | +1.50 – 2.50°C |
| Hot days | Up to +20 days | +1 to +30 days | Up to +30 days | +5 to +70 days |
| Heatwave days | Up to +20 days | Up to +30 days | Up to +20 days | Up to +70 days |
| Rainfall | -2% to +4% | ±4% | -2% to +8% | ±8% |
| 99th percentile daily rainfall | -1 to +15% | +2 to +15% | +1 to +15% | +3 to +30% |
| Dry spells | +1 to + 12 days | -4 to +10 days | -1 to +10 days | +1 to +12 days |
| Windy days | -5 to +5 days | -1 to +6 days | +1 to +5 days | +2 to +12 days |
| Upper Projection 2040 | Lower Projection 2040 | Intermediate Projection 2090 | Upper Projection 2090 | |
| Projected Sea Level Rise | +0.50m | +0.50m | +1.00m | +1.50m |
| 2040 | 2090 | |
| Fire hazard | +100% to +150% | +100% to +150% |
Want to find more information?
- Climate change projection for the Wairarapa – report
- Climate change projection for the Wairarapa – video
- Climate projections – GWRC map
- Sea level rise – GWRC map
- Sea level rise – Searise project
What can you do?
I am a resident
As a resident, there are many things you can do. A good place to start is to measure your carbon footprint to understand your greenhouse gas emissions. Tools such as FutureFit even gives you personalised actions that can help you reduce your footprint.
- Measure you carbon footprint:
o Future Fit
o Carbon Neutral NZ Trust, household calculator
o Ekos calculators – for individuals and households (lifestyle calculator) - Reduce your carbon footprint:
o Everyday life
o At home
o On the move - Assess and improve the health of your house
I am a farmer
Farmers have a huge role to play in both climate change mitigation and adaptation. He Waka Eke Noa is a five-year programme that will equip farmers and growers with the information, tools and support they need to reduce emissions and build resilience to climate change.
- ‘Know your number’ (measure your carbon footprint):
o He Waka Eke Noa tools
o Know your number - Reduce your farm emissions:
o GHG Farm Planning guidance
o Ag Matters
You can find more information about this programme here: - He Waka Eke Noa
- Ag Matters
I am a business
As a business, there are many things you can do. A good place to start is to measure your carbon footprint to understand your greenhouse gas emissions. The climate action toolbox can help your business reduces its carbon emissions
- Measure your business carbon footprint:
o Carbon Neutral NZ Trust, business calculator
o Ekos calculators – for businesses, schools and events - Reduce your business carbon footprint
- Climate action toolbox
- Assess and improve the health of your office(s)
Useful information
- GWRC climate page:
- What the government is doing about climate change:
- Climate change facts and science:
- Climate Change Response (Zero Carbon) Amendment Act 2019:
- Future Living Skills
- EV chargers:
- Funding available:
o EECA
o Ministry for the Environment:
o GWRC:
o Ministry of Primary Industries:
Climate Change Community Dashboards:
- Community Climate Dashboard July 2022
- Community Climate Dashboard June 2022
- Community Climate Dashboard May 2022
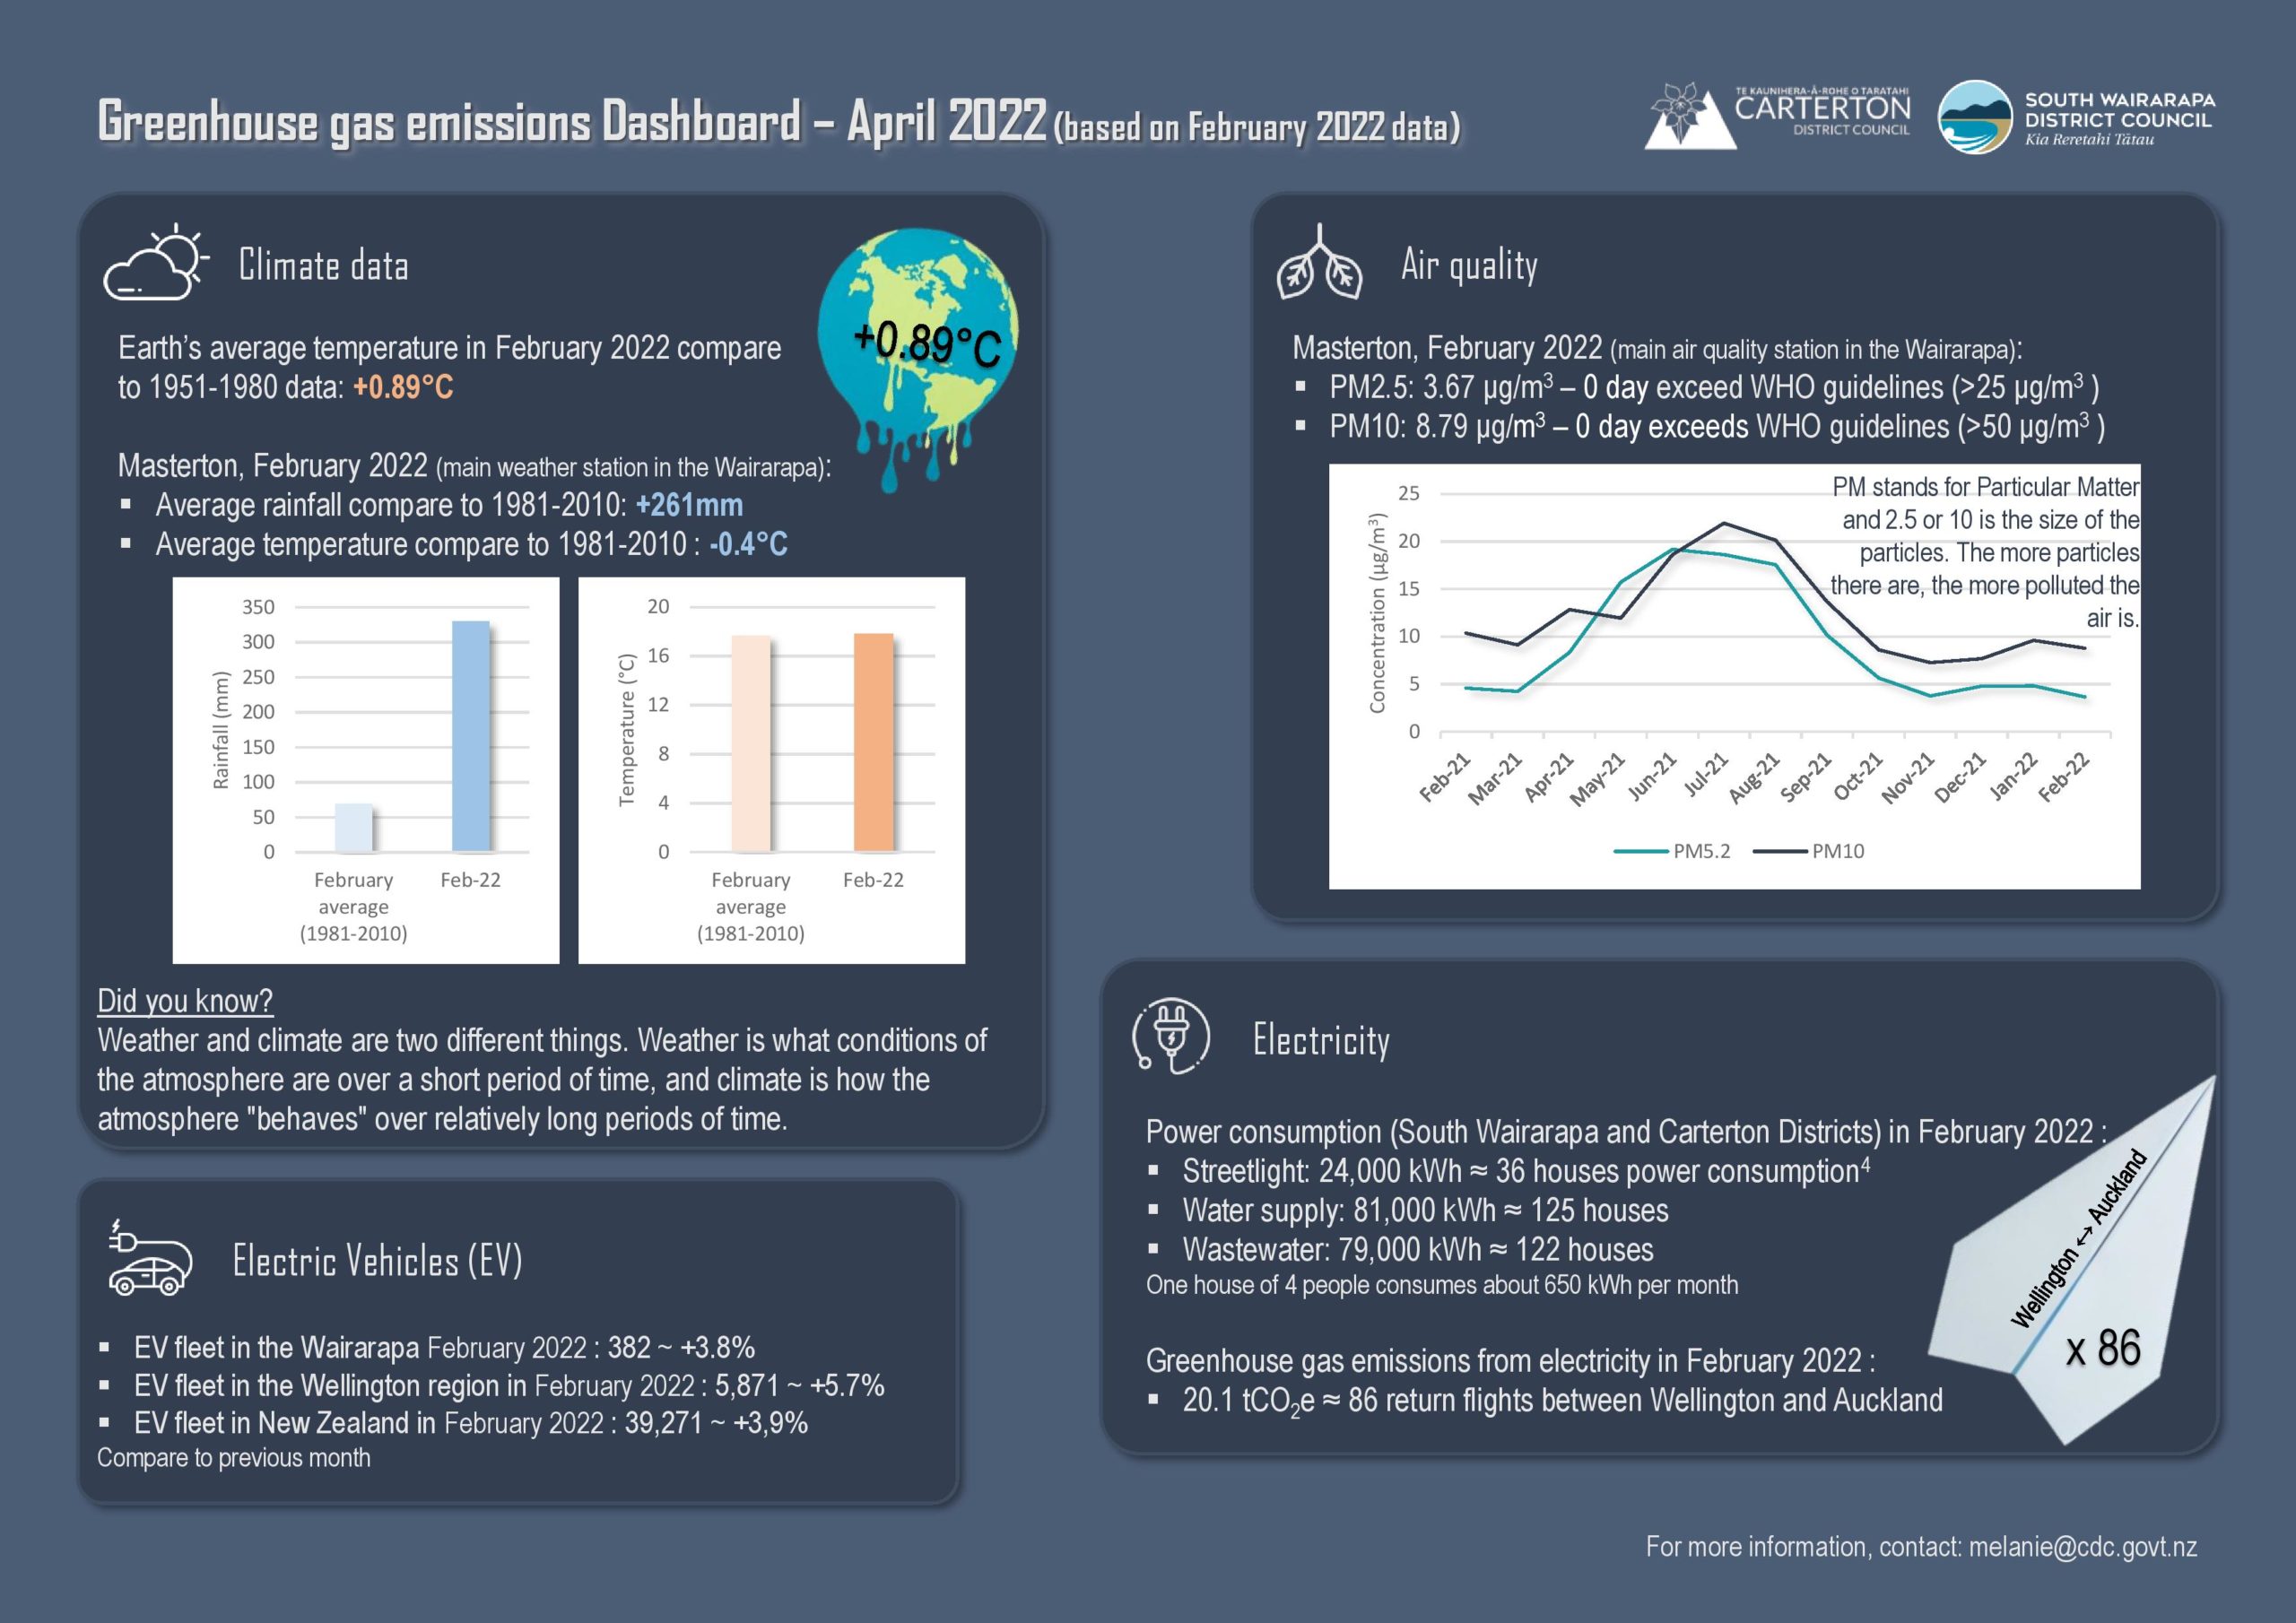
- Community Climate Dashboard April 2022
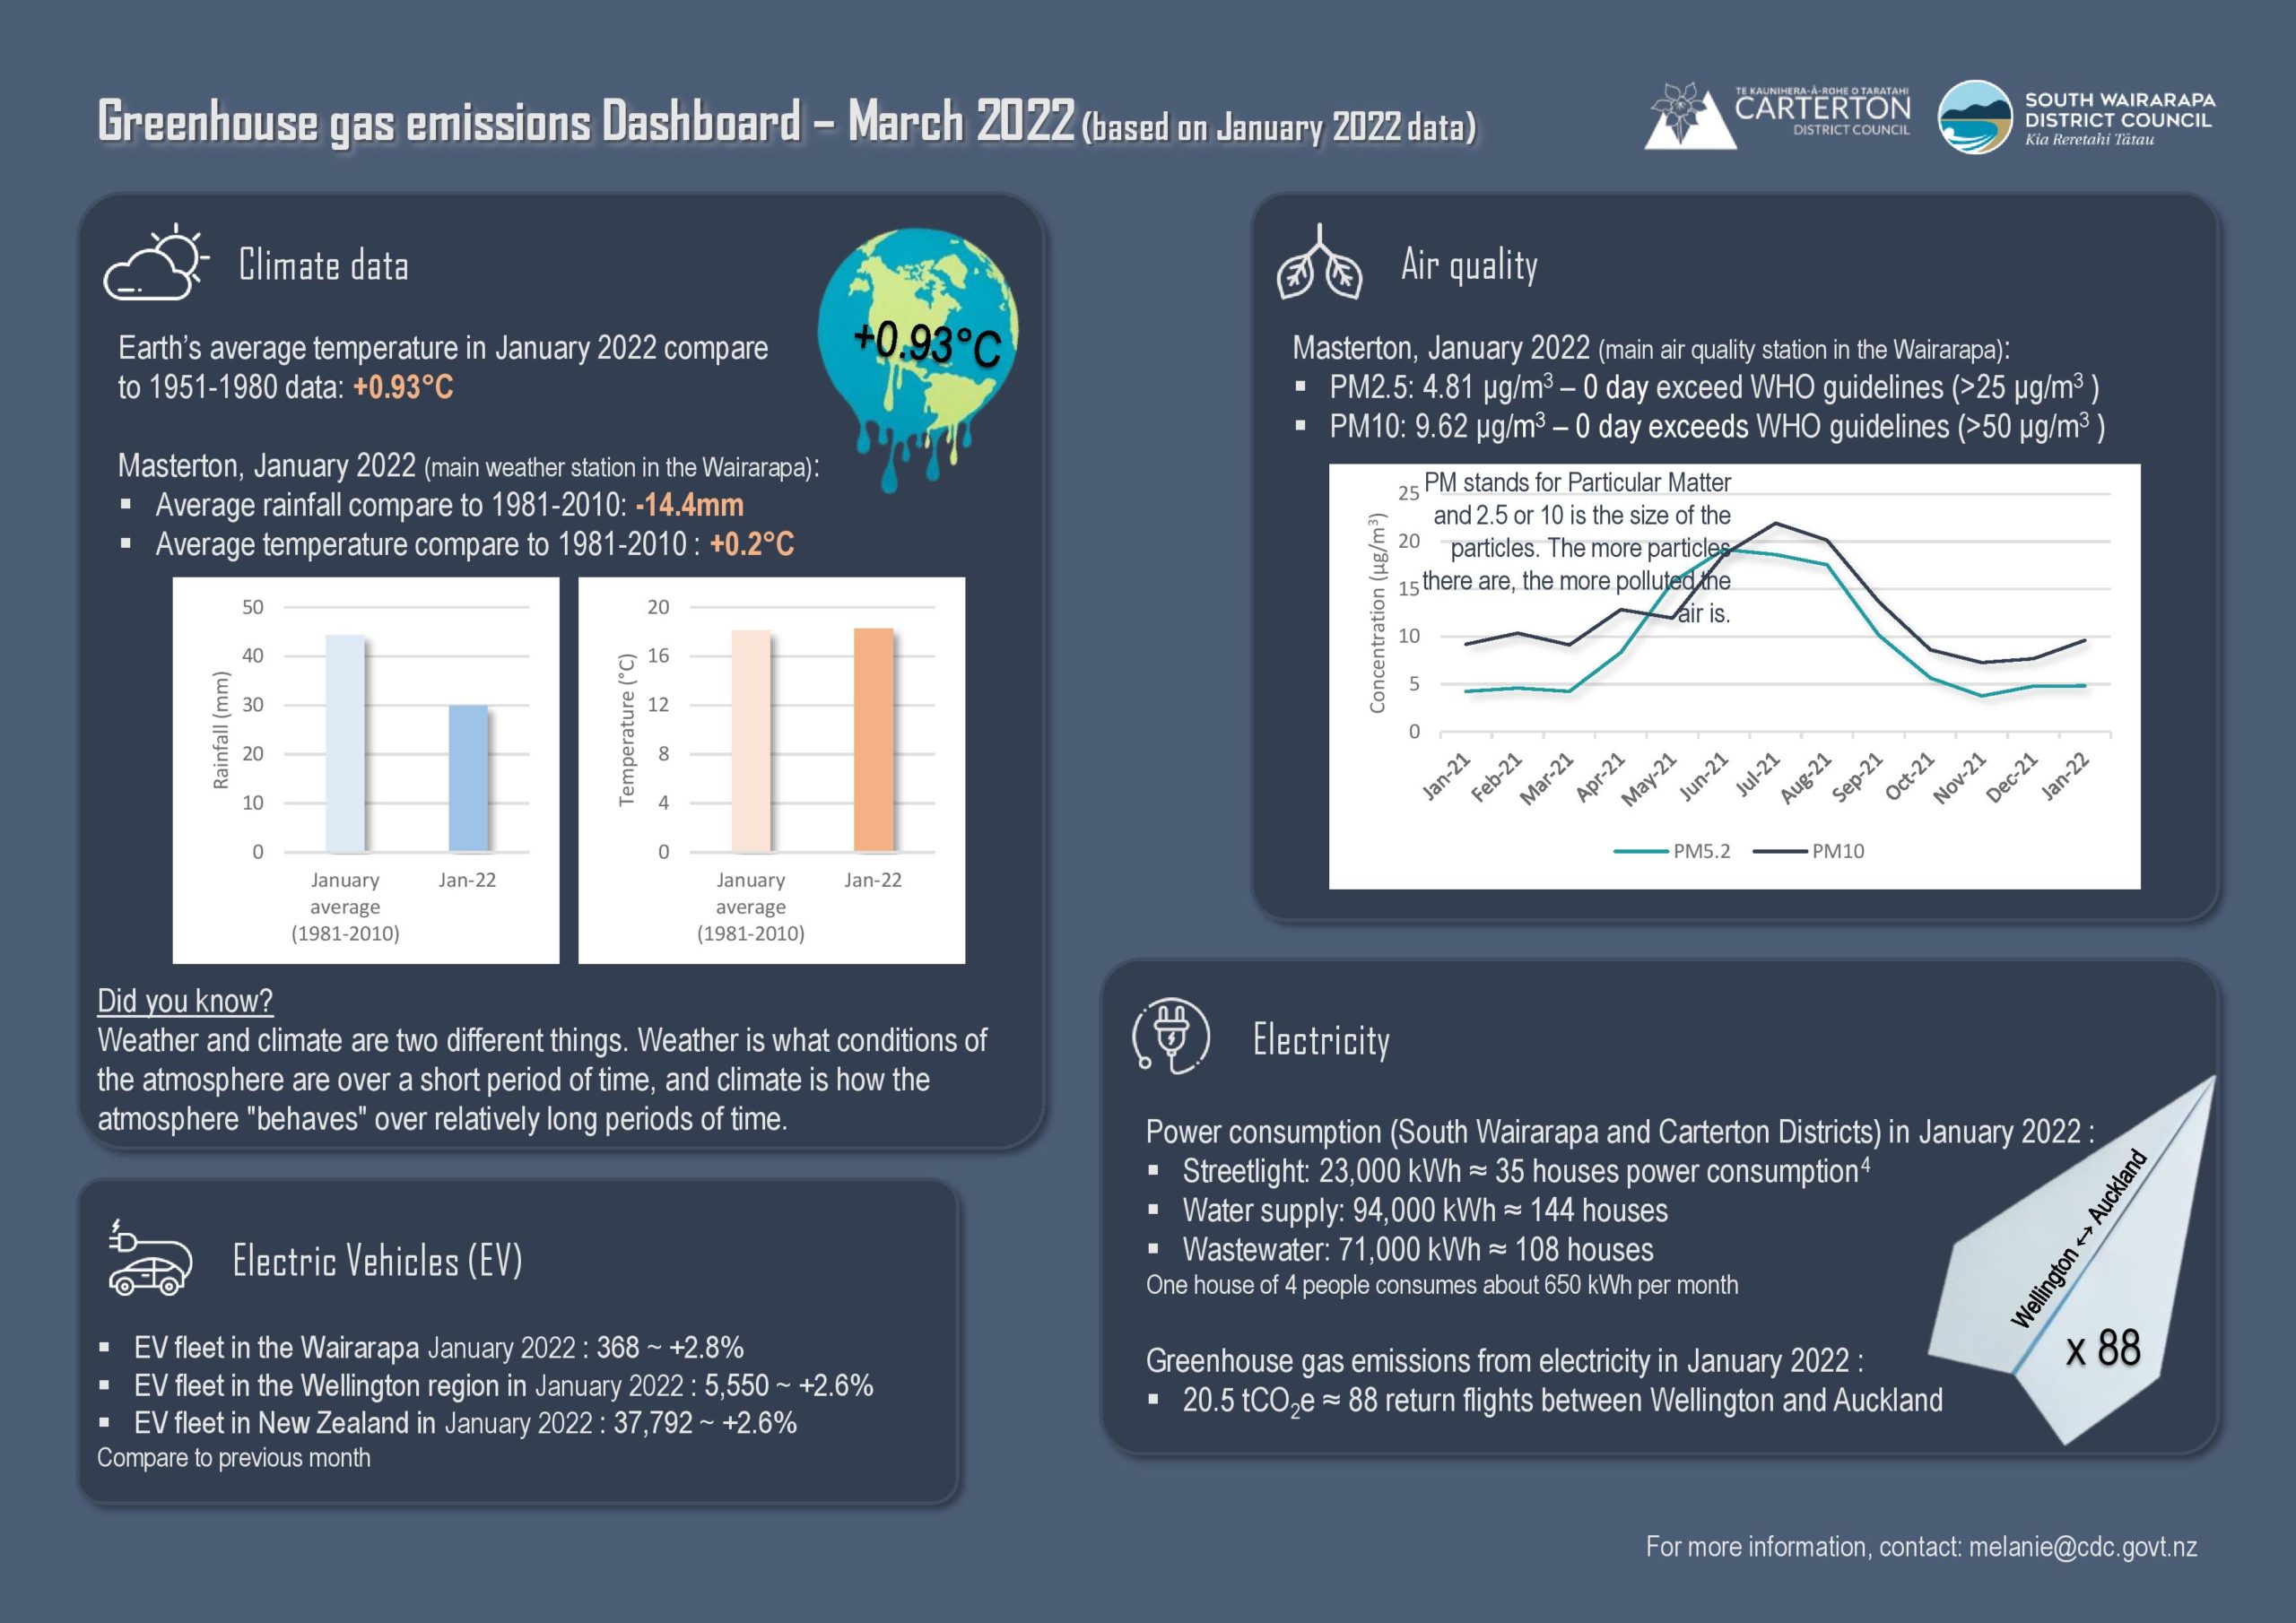
- Community Climate Dashboard March 2022
- Community Climate Dashboard February 2022
- Community Climate Dashboard January 2022
- Community Climate Dashboard December 2021
- Community Climate Dashboard November 2021
- Community Climate Dashboard October 2021
- Community Climate Dashboard September 2021
- Community Climate Dashboard August 2021
- Community Climate Dashboard July 2021
- Community Climate Dashboard June 2021
- Community Climate Dashboard May 2021